หน้าแรกของ IC Markets เข้าสู่ระบบ เว็บเทรดเดอร์ ติดต่อเรา
IC Markets Social IC Markets Social

Information Hub for
Serious Traders

  • เกี่ยวกับเรา
  • เปิดบัญชีเทรด
  • เปิดบัญชีเดโม่
  • เริ่มเทรด
  • เยี่ยมชมบล็อกของเรา
IC Markets Social
  • เกี่ยวกับเรา
  • เปิดบัญชีเทรด
  • เปิดบัญชีเดโม่
  • เริ่มเทรด
  • เยี่ยมชมบล็อกของเรา
June 28, 2024Australian_Stocks_enIC Markets

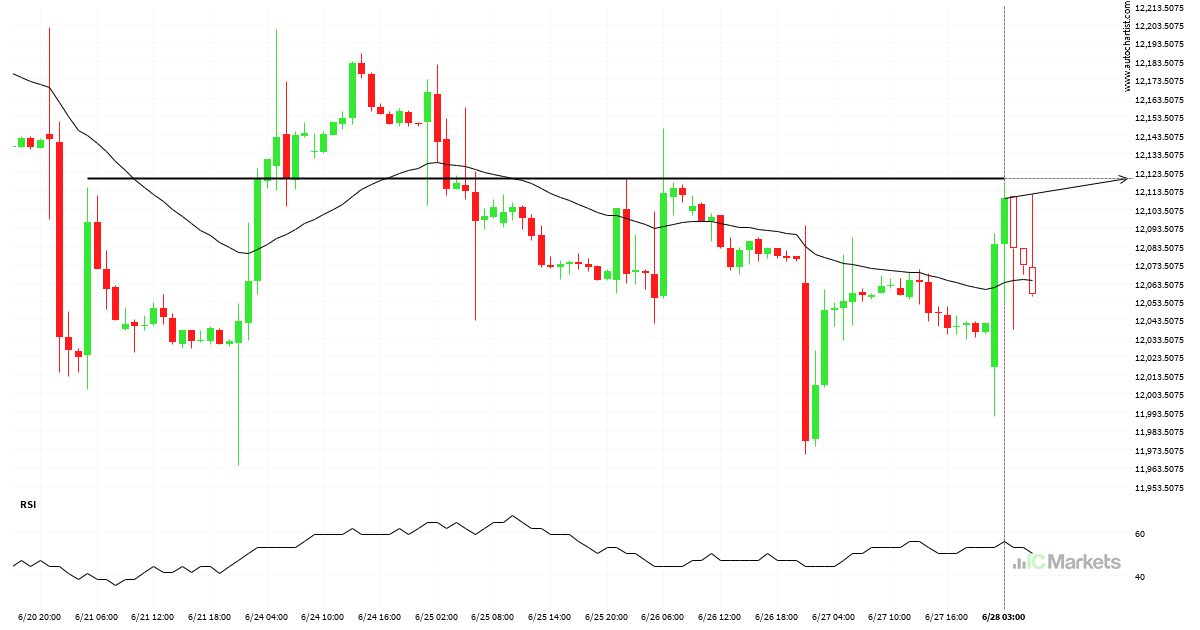
Should we expect a breakout or a rebound on FTSE China A50 Index?

The movement of FTSE China A50 Index towards 12120.0195 price line is yet another test of the line it reached numerous times in the past. We could expect this test to happen in the next 20 hours, but it is uncertain whether it will result in a breakout through this line, or simply rebound back […]

Read more
June 27, 2024Australian_Stocks_enIC Markets

Possible start of a bearish trend on Hong Kong 50 Index

Hong Kong 50 Index has broken through 17884.0391 which it has tested numerous times in the past. We have seen it retrace from this price in the past. If this new trend persists, Hong Kong 50 Index may be heading towards 17583.6797 within the next 3 days.

Read more
June 25, 2024Australian_Stocks_enIC Markets

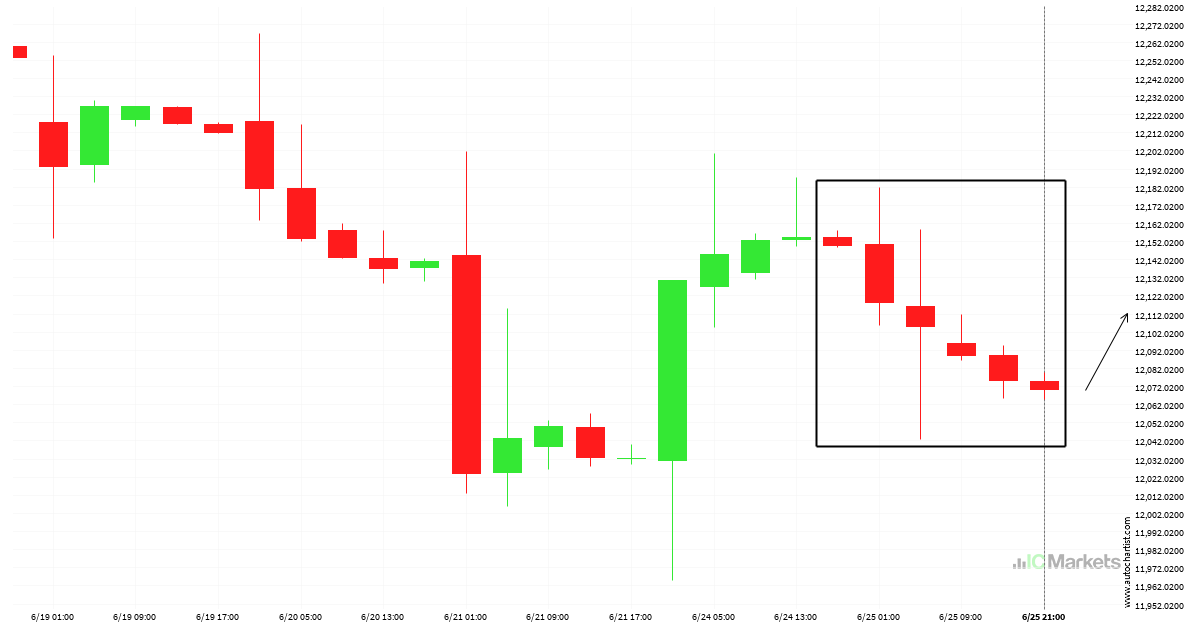
Is FTSE China A50 Index likely to correct after consecutive bearish candles?

FTSE China A50 Index has moved lower after 6 consecutive 4 hour candles from 12154.5200 to 12069.6700 in the last 2 days.

Read more
June 25, 2024Australian_Stocks_enIC Markets

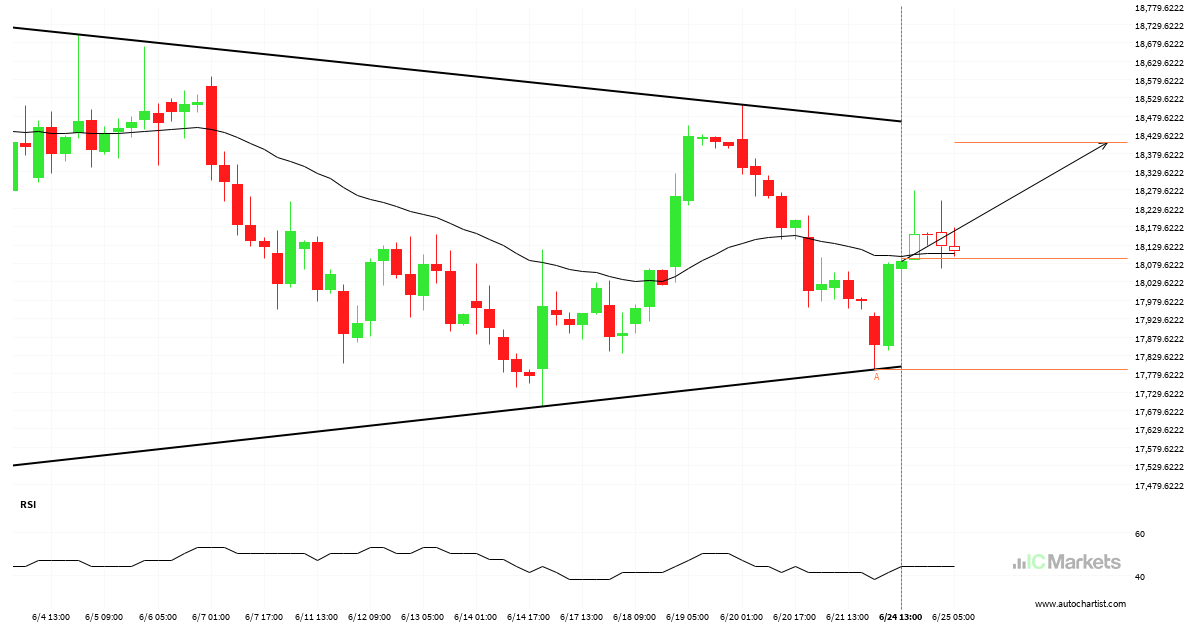
Hong Kong 50 Index – getting close to resistance of a Triangle

Emerging Triangle pattern in its final wave was identified on the Hong Kong 50 Index 4 hour chart. After a strong bullish run, we find Hong Kong 50 Index heading towards the upper triangle line with a possible resistance at 18407.8195. If the resistance shows to hold, the Triangle pattern suggests a rebound back towards […]

Read more
June 24, 2024Australian_Stocks_enIC Markets

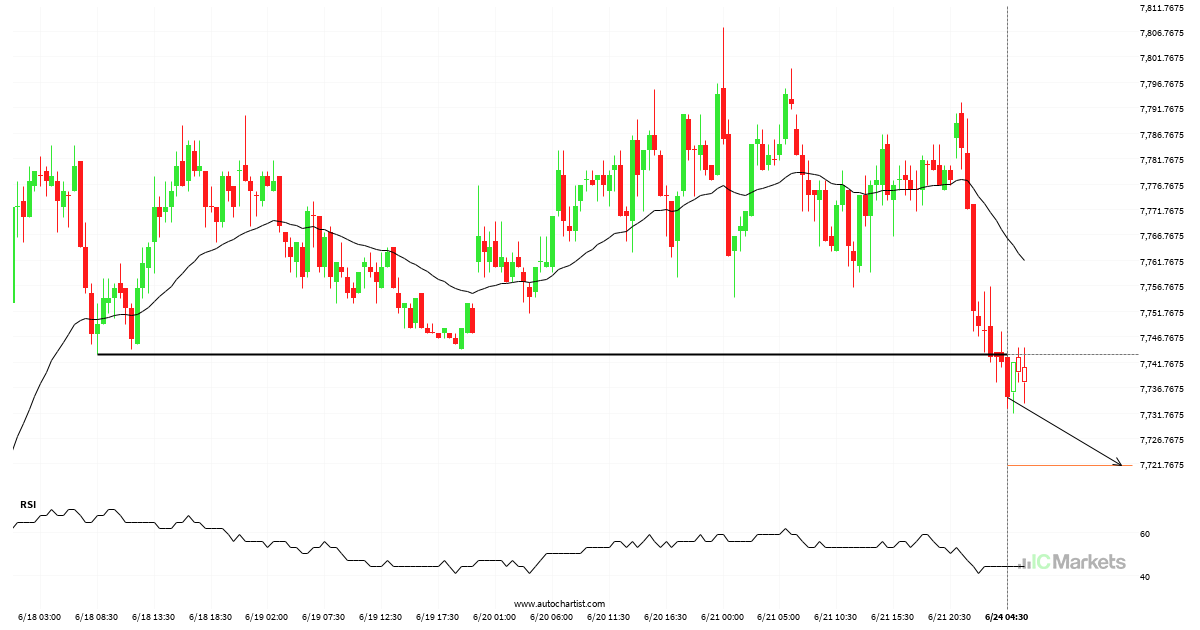
Should we expect a bearish trend on Australia 200 Index?

The breakout of Australia 200 Index through the 7743.2500 price line is a breach of an important psychological price that is has tested numerous in the past. If this breakout persists, Australia 200 Index could test 7721.5200 within the next 18 hours. One should always be cautious before placing a trade, wait for confirmation of […]

Read more
June 23, 2024Australian_Stocks_enIC Markets

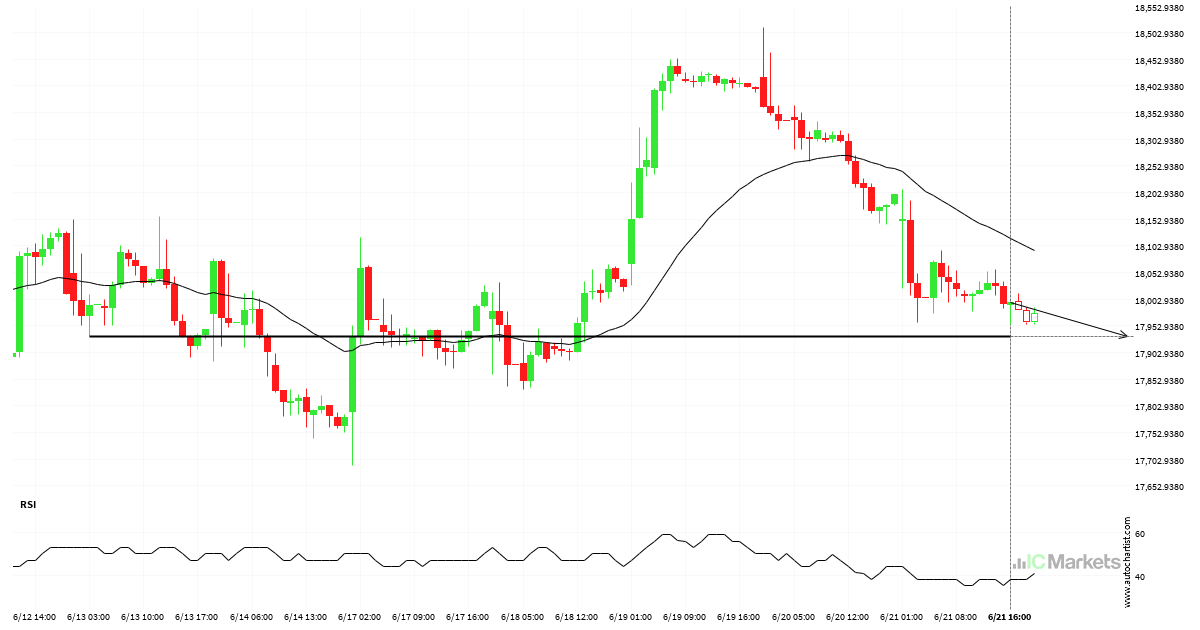
Hong Kong 50 Index short term bearish trade setup to 17933.6699

Hong Kong 50 Index is heading towards 17933.6699 and could reach this point within the next 2 days. It has tested this line numerous times in the past, and this time could be no different, ending in a rebound instead of a breakout. If the breakout doesn’t happen, we could see a retracement back down […]

Read more
June 21, 2024Australian_Stocks_enIC Markets

Is FTSE China A50 Index likely to correct after this massive movement?

FTSE China A50 Index has experienced an exceptionally large movement lower by 1.52% from 12215.32 to 12030.07 in the last 2 days.

Read more
June 19, 2024Australian_Stocks_enIC Markets

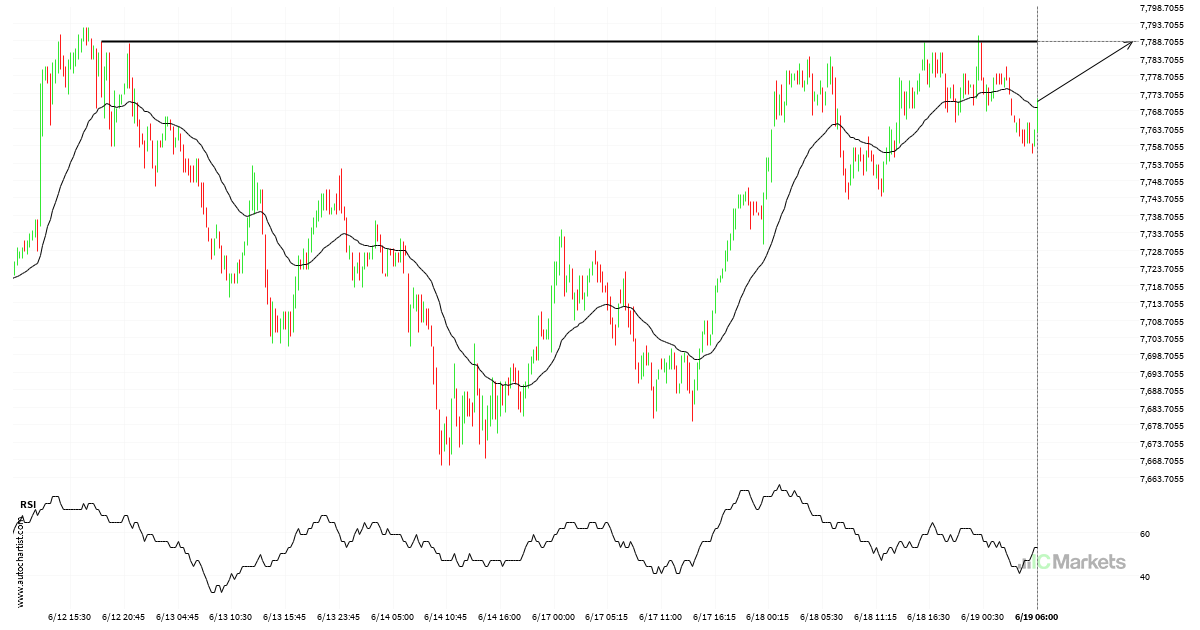
Australia 200 Index short term bullish trade setup to 7788.4399

The movement of Australia 200 Index towards 7788.4399 price line is yet another test of the line it reached numerous times in the past. We could expect this test to happen in the next 23 hours, but it is uncertain whether it will result in a breakout through this line, or simply rebound back to […]

Read more
June 18, 2024Australian_Stocks_enIC Markets

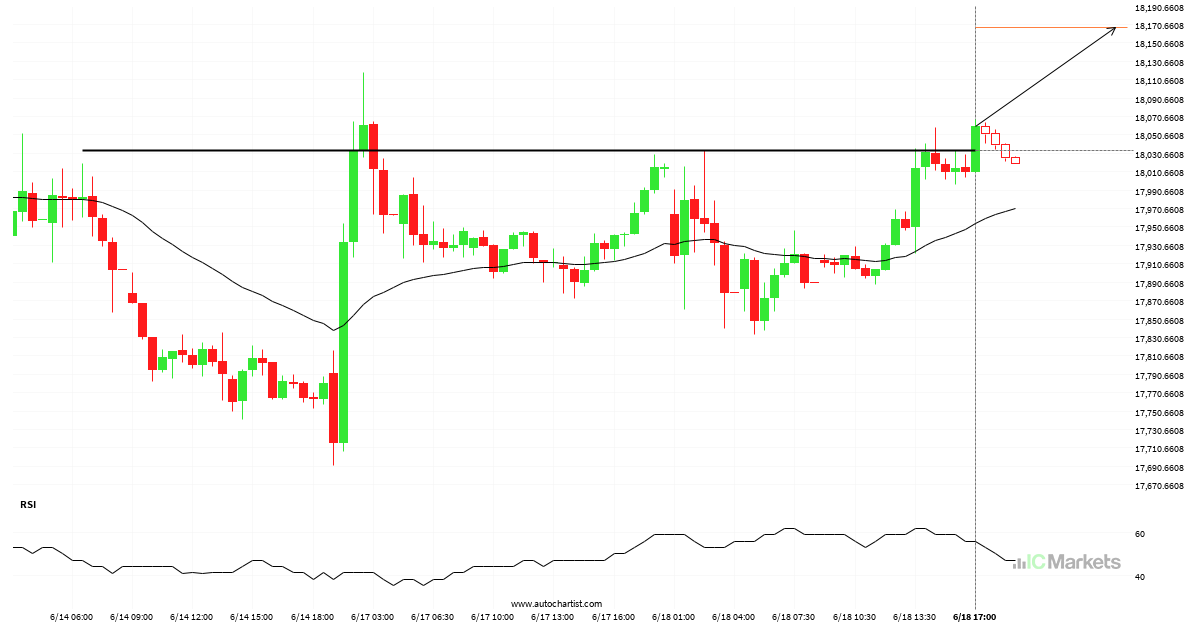
Should we expect a bullish trend on Hong Kong 50 Index?

The breakout of Hong Kong 50 Index through the 18034.0391 price line is a breach of an important psychological price that is has tested numerous in the past. If this breakout persists, Hong Kong 50 Index could test 18166.9141 within the next 9 hours. One should always be cautious before placing a trade, wait for […]

Read more
June 17, 2024Australian_Stocks_enIC Markets

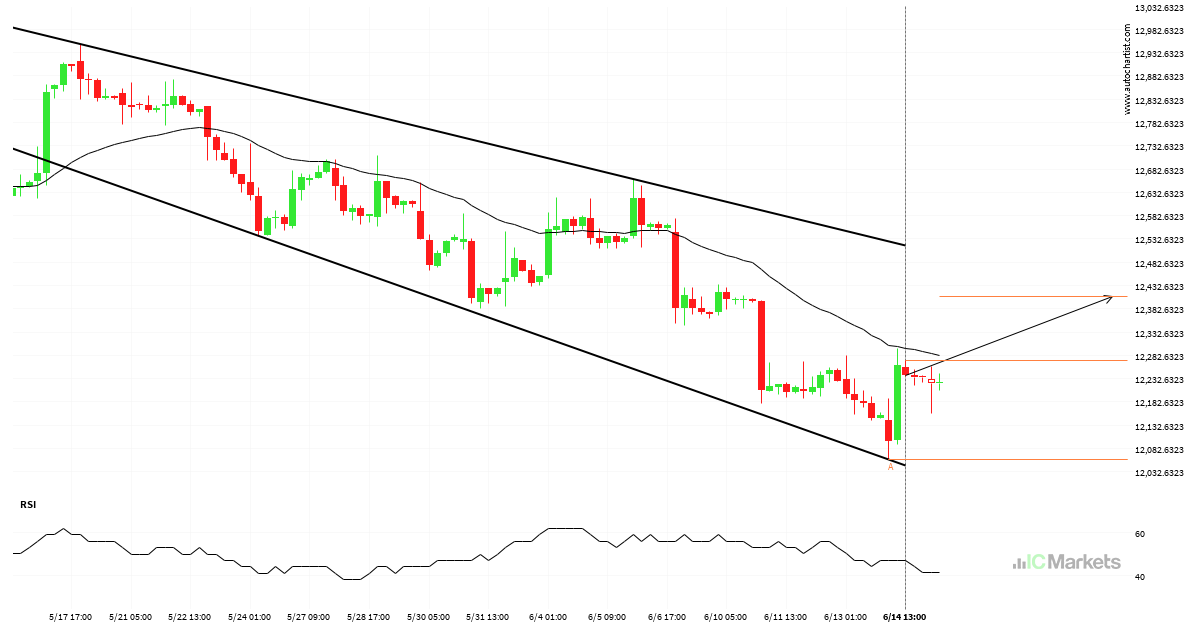
FTSE China A50 Index – Continuation Chart Pattern – Channel Down

FTSE China A50 Index is trapped in a Channel Down formation, implying that a breakout is Imminent. This is a great trade-setup for both trend and swing traders. It is now approaching a support line that has been tested in the past. Divergence opportunists may be very optimistic about a possible breakout and this may […]

Read more
  • 1
  • 2
  • 3
  • …
  • 8
  • 9
  • 10
  • 11
  • 12
  • 13
  • 14
  • …
  • 153
  • 154
  • 155

Recent Posts

  • Hong Kong 50 Index – รูปแบบกราฟ – สามเหลี่ยมขาขึ้น
  • Hong Kong 50 Index – نموذج الرسم البياني – مثلث صاعد
  • Germany 30 Index – ระดับสำคัญ – แนวรับ
  • Germany 30 Index – المستوى الرئيسي – سند
  • Hong Kong 50 Index – المستوى الرئيسي – مقاومة

Recent Comments

    Translation


     Edit Translation

    เปิดบัญชีและฝากเงินได้แบบทันที

    เทรดได้ภายในไม่กี่นาที!

    เริ่มต้น ลองบัญชีเดโมได้ฟรี

    การเทรดฟอเร็กซ์

    • ภาพรวมของบัญชี
    • เปิดบัญชี
    • ใช้งาน Web Trader

    รายละเอียดของการซื้อขาย

    • สเปรดและค่าคอมมิชชั่น
    • ขอบเขตของตลาด
    • ช่วงเวลาซื้อขาย
    • การเพิ่มเงิน
    • การถอนเงิน

    เกี่ยวกับ IC Markets

    • Help Centre
    • ทำไมถึงต้องเป็น IC Markets
    • กฎระเบียบ
    • เอกสารทางกฎหมาย
    • ติดต่อเรา


    Forex Trading

    • Accounts Overview
    • Open an Account
    • Launch Web Trader

    Trading Specifications

    • Spreads and Commissions
    • Range of Market
    • Trading Hours
    • Funding
    • Withdrawal

    About IC Markets

    • Chat with a Specialist 24/7
    • Why IC Markets
    • Regulation
    • Legal Documents
    • ติดต่อเรา

    ข้อความจำกัดความรับผิดชอบ: เนื้อหาข้อมูลนี้เป็นเนื้อหาด้านการตลาดซึ่งได้ถูกเผยแพร่เพื่อวัตถุประสงค์ในการให้ข้อมูลเท่านั้น เนื้อหานี้ไม่ได้ประกอบไปด้วยและไม่ควรถือว่าประกอบไปด้วยคำแนะนำหรือการเสนอแนะด้านการลงทุน หรือการแนะนำให้มีการดำเนินการใดๆ กับตราสารทางการเงิน วิดเจ็ตที่แสดงอยู่ภายในเป็นของผู้จัดทำจากภายนอกและ IC Markets ไม่มีส่วนรับผิดชอบใดๆ เกี่ยวกับเนื้อหาและผลกระทบที่มีต่อการเทรด

    สงวนลิขสิทธิ์สำหรับเนื้อหาทั้งหมด ความคิดเห็นของผู้จัดทำอาจไม่สอดคล้องกับความคิดเห็นของผู้จัดทำบล็อก เมื่อมีการคัดลอกเนื้อหาจากเว็บไซต์นี้หรือมีการเชื่อมโยงไปยังฟีด RSS เพื่อเผยแพร่บทความของเรา ผู้ที่ทำการคัดลอกจะต้องใส่ลิงก์ไปยัง IC Markets หรือมีการระบุแหล่งที่มาในรูปแบบ ‘IC Markets Blog’ สำหรับคำถามโดยทั่วไปโปรดติดต่อสำนักงานบรรณาธิการผ่านทางแบบฟอร์มบนหน้าติดต่อเรา

    คำเตือนเกี่ยวกับความเสี่ยง: การเทรดตราสารอนุพันธ์มีความเสี่ยงในระดับสูงกับเงินทุนของคุณและคุณควรทำการเทรดด้วยเงินที่คุณ สามารถรับการขาดทุนได้เท่านั้น การเทรดตราสารอนุพันธ์อาจไม่เหมาะกับนักลงทุนทุกท่าน ดังนั้นโปรดทำความเข้าใจกับความเสี่ยงที่เกี่ยวข้องและหาคำแนะนำที่เป็นอิสระหากจำเป็น นักลงทุนควรศึกษา Product Disclosure Statement (PDS) ก่อนทำธุรกรรมใดๆ กับเรา

    เนื้อหาข้อมูลที่ถูกแสดงอยู่บนหน้านี้เป็นข้อมูลโดยทั่วไปเท่านั้นและไม่ได้มีการคำนึงถึงสถานการณ์ส่วน ตัวของคุณ, เป้าหมายทางการเงิน หรือความต้องการของคุณ คุณเป็นผู้พิจารณาว่าผลิตภัณฑ์ต่างๆ ที่เรามีให้บริการเหล่านี้ตรงกับความต้องการของคุณหรือไม่ อีกทั้งคุณไม่ควรทำการเทรดกับเราจนกว่าคุณจะเข้าใจถึงคุณสมบัติและความเสี่ยงที่เกี่ยวข้องกับผลิตภั ณฑ์ที่เรามีให้บริการ นั่นหมายความว่าคุณอาจต้องการคำแนะนำที่เป็นอิสระก่อนที่คุณจะเริ่มต้นเทรดกับเรา

    © 2022 Raw Trading Ltd | All rights reserved.
    • Sample Page